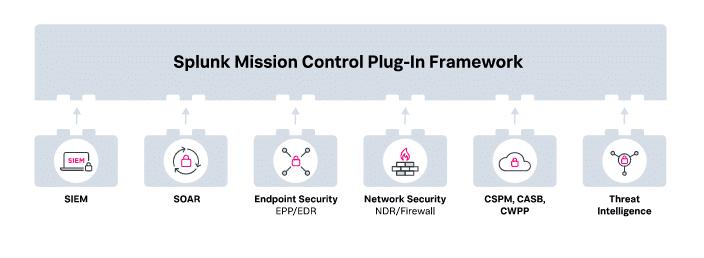
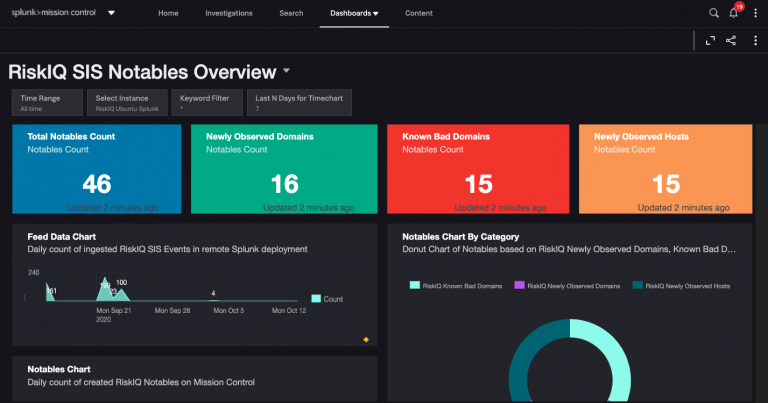
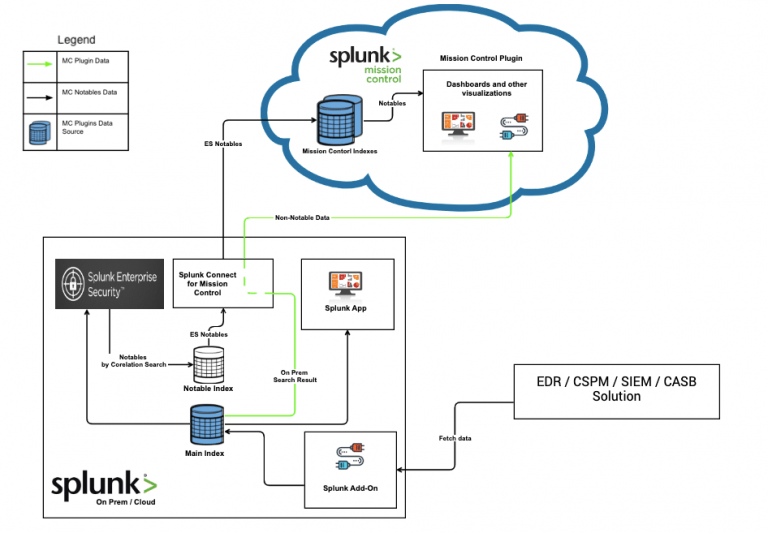
We can develop attractive Splunk dashboards backed by the powerful new Unified Dashboard Framework (UDF). What’s more interesting is, that these dashboards can fetch data from both Mission Control Indexes & On-Prem/Cloud Splunk Deployments. These dashboards are bundled within the Mission Control Plugin and available to MC users once the plugin is enabled.
Here is a dashboard for RiskIQ’s SIS Notables,
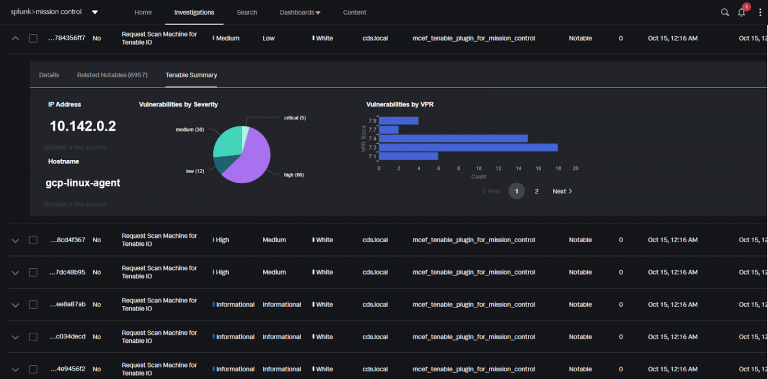
A normal day in a SOC analyst’s life starts with triaging security incidents (Notables), this involves traversing multiple tools to gather the right insight. Mission Control eases this task by introducing Analyst Queue Tabs, these tabs open when a Notable is expanded on Mission Control’s Investigation dashboard, the Plugin Framework allows developers to populate the desired visualizations within these Analyst Queue tabs. This would provide the analyst a direct visibility into the insights provided by various CSPM/SIEM/EDR tools at the same place.
Here’s how an Analyst Queue Tab for Tenable Vulnerabilities looks,
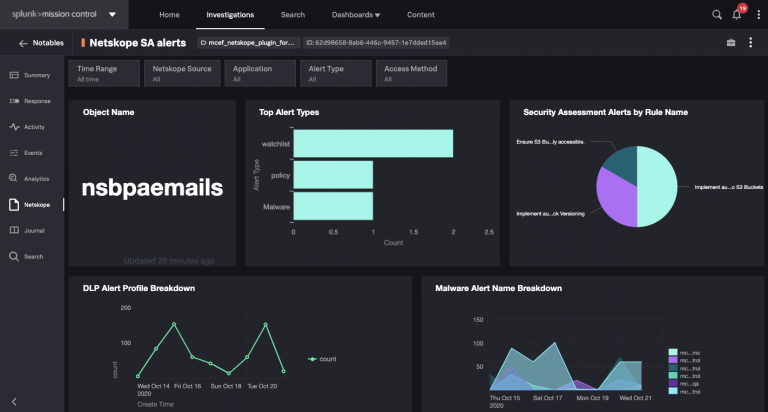
While investigating a security incident, a real-time data-driven insight is often required, this would again involve traversing a lot of tools and filtering the data with the right indicators, with Investigation tabs, Mission Control allows users to drill down into the incident and view detailed dashboards for each incident, known as Investigation Tabs, Plugin Framework allows developers to add their own tabs. The best part about this is, unlike normal dashboards, these views are specific to the drilled down incident.
Here’s an Investigation tab for Netskope which provides visibility about alerts on the object being investigated.
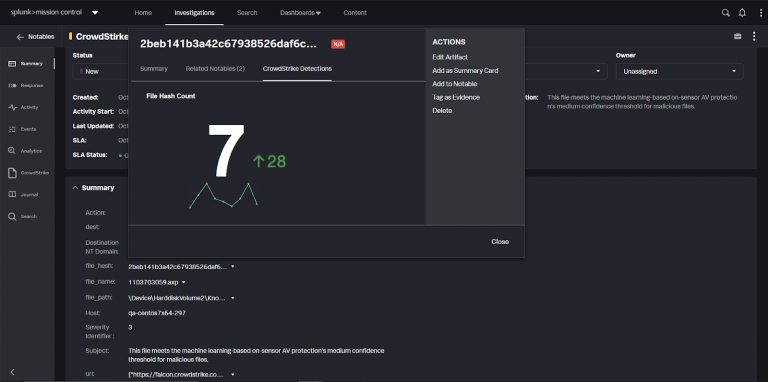
At times, an Analyst needs insights about specific indicators (fields), which involves searching for the indicator across various platforms, with Mission Control, users can just click on the indicator, and a contextual menu pops up with tabs with the desired visualizations. Here’s how a context menu tab looks like for CrowdStrike Detections on a file’s SHA,